Details on Results: Graphic
Information on the Graphics tab in the Results section when calculating the cooling load at room level by the abbreviated method.
You are here:
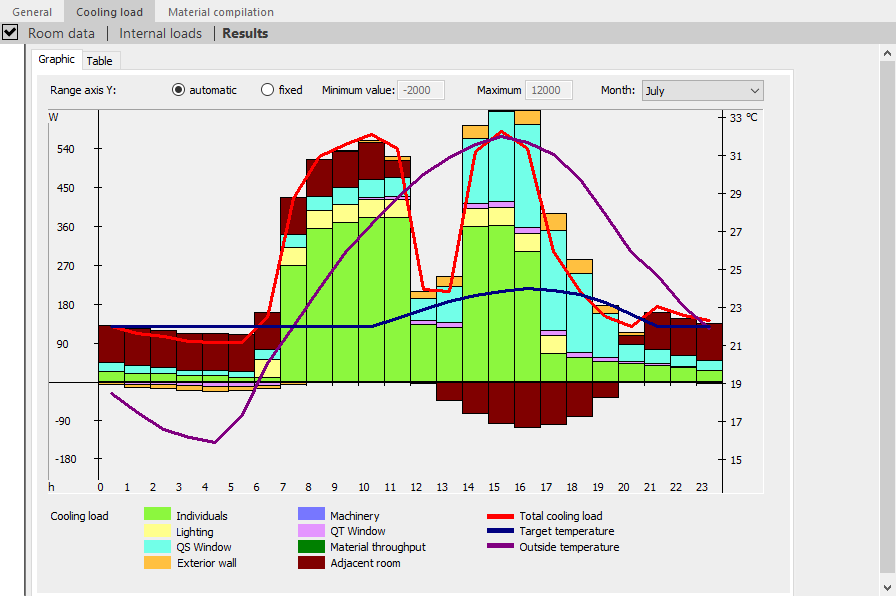
Diagram: At room level, depicts the results of the cooling load calculation in the short procedure as a diagram.
Y-axis value range: Sets the value range to be displayed. Automatic displays the entire calculated range. The Fixed option allows manual setting of minimum and maximum values.
Minimum value: Starting value on the Y-axis (in the fixed value range).
Maximum value: End value on the Y-axis (in the fixed value range).
Month: Selection of the design month for which the results are to be displayed.