![[Translate to Englisch:] Behaglicher Komfort vs. Energieeinsparung](/fileadmin/_processed_/b/5/csm_LP_Titel_KeyVisua_neu_abd525d695.jpg)

Comfort according to DIN EN ISO 7730
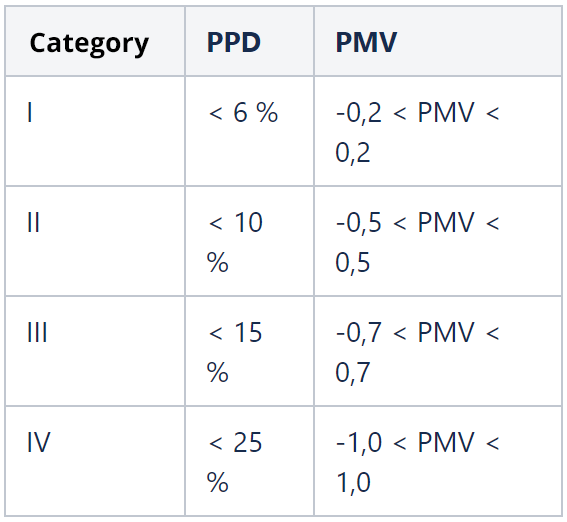
DIN EN ISO 7730 "Ergonomics of the thermal environment - Analytical determination and interpretation of thermal comfort [...]" describes a model for predicting the percentage of people who are likely to perceive an ambient climate as too warm or too cold. The percentage of dissatisfied people is referred to as PPD (predicted percentage of dissatisfied) and is based on the predicted mean vote (PMV) of a large group of people who rated the ambient climate in experiments using a 7-point rating scale. Figure 1 shows the rating scale and the course of the PPD depending on the PMV. Under optimal conditions with a PMV of 0, about 5 % of the people in the room will still be dissatisfied with the indoor climate. In other words, it means that you can never satisfy all people with a certain indoor climate, but you define how big the percentage of dissatisfied people can be. For this purpose, DIN EN ISO 7730 introduces three categories for the ambient climate, which are differentiated by the percentage of dissatisfied persons. In DIN EN 16798-1 "Indoor environmental input parameters for design and assessment of energy performance of buildings addressing indoor air quality, thermal environment [...]", the categories from DIN EN ISO 7730 are extended by one level (see Table 1).
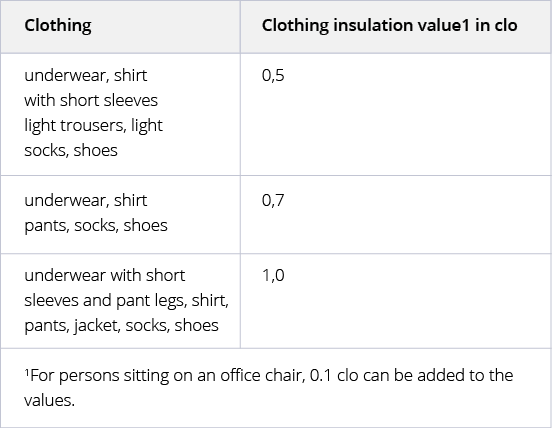
The PMV index is based on the thermal equilibrium of the human body with its environment. The parameters included in the PMV index are air temperature, relative air velocity, air humidity, mean radiant temperature, and body energy conversion and clothing insulation. Energy conversion is often expressed in the metabolic unit met and clothing insulation in the clothing unit clo. Typical values for the two quantities and their significance are given in Table 2 and Table 3.


Design temperatures based on the standard
In the heating load calculation according to DIN/TS 12831-1, a design temperature of 20 °C is required for almost all rooms in which people regularly spend time. For rooms used without clothing, e.g. bathrooms and changing rooms, a temperature of 24 °C should be maintained. In commercially used rooms where standing activities are carried out, 17 °C is required for medium-heavy activities and 15 °C for heavy activities. In particular, the description of commercial spaces suggests that the design values have been derived using the comfort model. This becomes clearer when looking at DIN EN 16798-1. In the standard, the minimum design values for heating and the maximum values for cooling are specified depending on the category and the activity level. A clothing insulation of 1.0 clo is assumed for winter and 0.5 clo for summer (see Table 4). In order to check which comfort criteria are applied for the design temperatures, the temperatures for the limit values of the comfort categories are determined under the specified boundary conditions and compared with the standard values (see Table 5, the temperatures explicitly addressed in the following discussion are formatted in bold). The values from the comfort model coincide very well with the values for the summer period from DIN EN 16798-1. Only category II requires a design temperature of 26 °C, which is 0.4 K lower than the temperature at which 10 % of people are dissatisfied. The situation is different for the winter period: Here, the temperatures for sedentary activity differ by up to 0.9 K between the comfort model and the values from the standard. In the first two categories, the comfort model provides lower temperatures and turns for the other two categories. For the standing activity, on the other hand, the values for the first two categories again fit well. If you compare the values from the heat load calculation with DIN 16798-1, you can equate the requirements from the heat load calculation with those from category II. Compared to the comfort model, the values of the heat load calculation show a similar picture as in DIN EN 16798-1. Category II temperatures of the comfort model are about 1.0 K lower than required in the heat load calculation for the sedentary and standing activities with clothing. For the rooms that are used without clothing, however, the comfort model provides 25 °C for category II, which is 1.0 K higher than the 24 °C used in the heating load calculation.
Basically, it can be observed that the values from the standards are based on the comfort model. For individual values, however, the results from the model have been slightly adjusted for the standard. The reasons for the adjustments cannot be derived from the given information, especially since DIN EN 16798-1 specifies all input parameters for the comfort model.
Influence of design temperature on capacity and energy demand
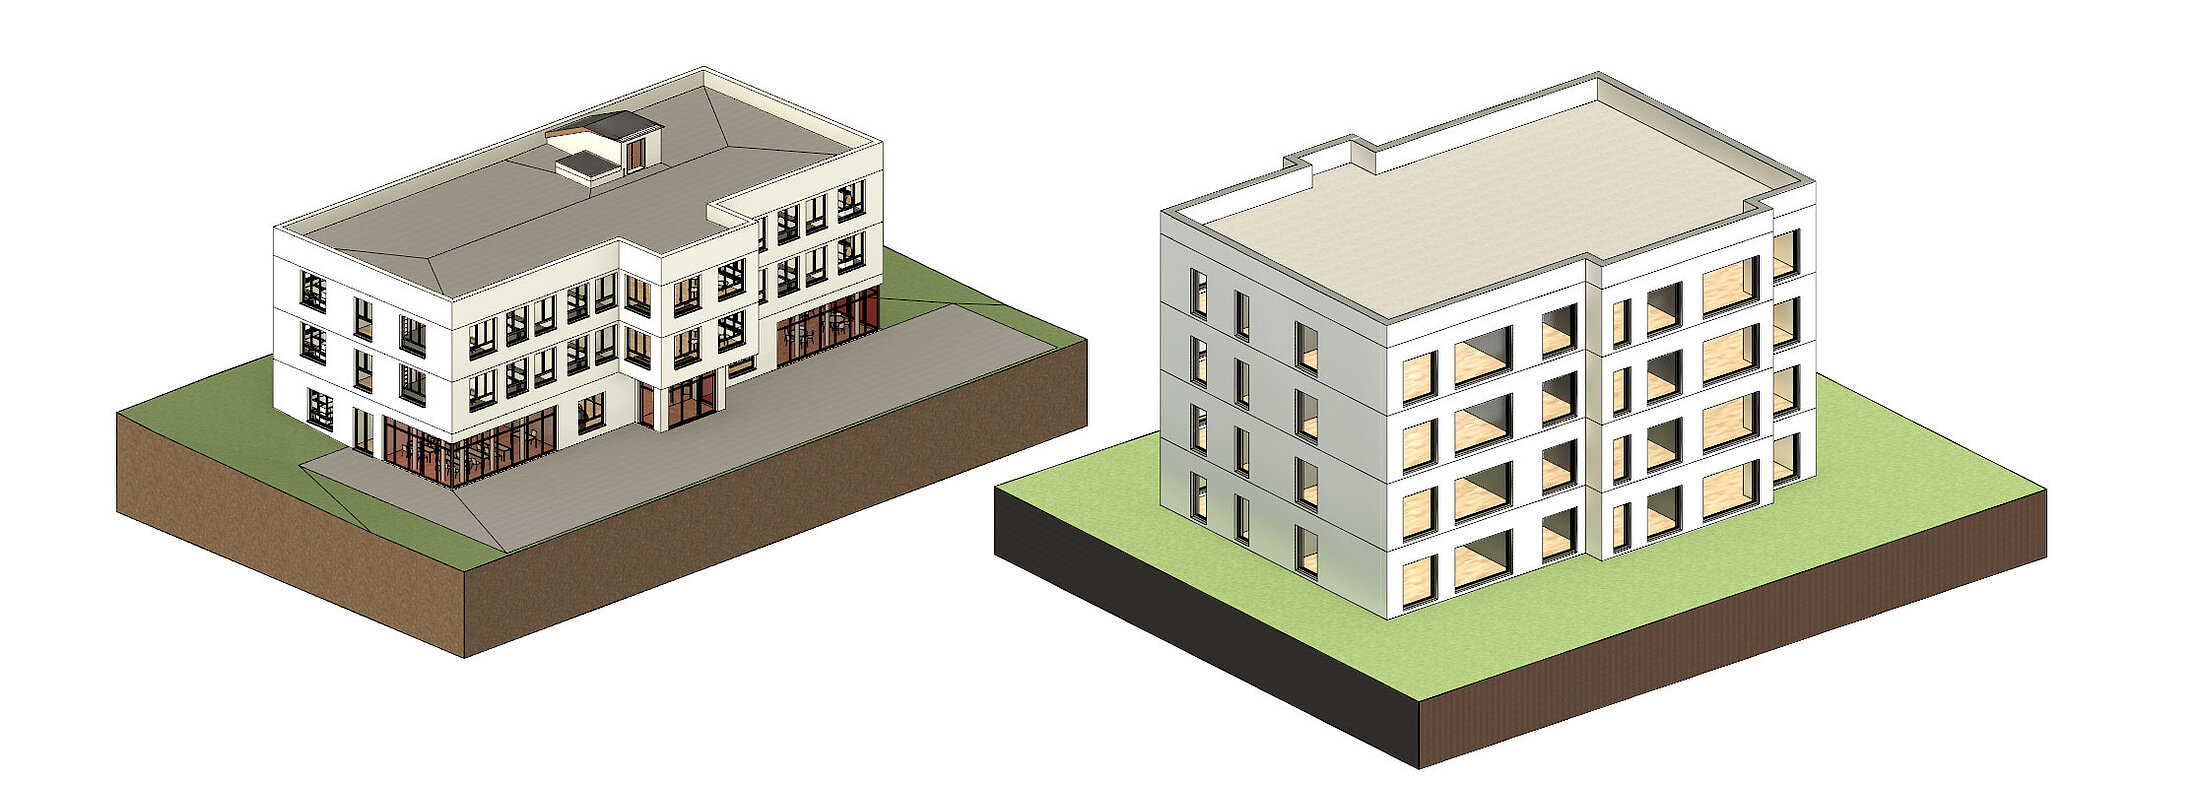
From the values in Table 5, we can see the logical relationship that with more clothing, the temperature in the room can be lower in order to perceive the environment as comfortable. Now the question can be asked, what is an appropriate level of comfort provided by building technology, so as not to promote unnecessary energy consumption? For example, does it make sense with regard to energy expenditure to create a comfortable environment in winter for people in summer clothing? How many dissatisfied people can be accepted when calculating peak loads? In order to better estimate the influence of the design temperatures on the load calculation and the energy demand, the heat load according to DIN/TS 12831-1, the maximum heat load and the annual heating energy demand are determined below for two example buildings from an annual simulation of the module Dynamic Cooling Load in LINEAR Building for several design temperatures (see Figure 2).


If a location of the building in Aachen, Germany is assumed, the standard outdoor temperature for the heating load calculation is -8.6 °C. The lowest outdoor temperature is reached on January 3 in the test reference year and is -7.7 °C (see Figure 3). In these buildings, the design temperature is varied in all the rooms where people regularly spend time and where a design temperature of 20 °C is therefore specified for the heat load calculation. In the annual simulation, as provided in the heat load calculation, the internal loads of persons and machines are deactivated. Infiltration with outdoor air is set for the rooms as in the heating load calculation. Solar radiation is included in the annual simulation because a) solar radiation leads to more realistic heating outputs in the transition period (see Figure 4), and b) it does not affect the maximum heating output because the lowest temperatures are at night.
Figure 5 shows the results of the calculations for the residential building. The calculated heating loads from DIN/TS 12831-1 are about 2 kW higher than the heating load determined from the annual simulation. Basically, the two curves run parallel to each other over the temperature band under consideration. The differences between the two methods of calculating of the heat load can be explained on the one hand by the lower temperature in the heating load calculation, and on the other hand the lowest outdoor temperature in the annual simulation prevails only for a short period of time, so that no stationary temperature gradient can occur through the wall, as assumed in the heating load calculation according to DIN/TS 12831-1. In Figure 5, the heat load curves are approximated with exponentiation, since this type of function provides the smallest deviations from the calculation points. In the analyzed temperature band, the course of the heating load can also be mapped with a linear function with slightly larger deviations. In the case of heating energy demand, on the other hand, the progression according to exponentiation is more clearly visible.
To illustrate the influence of the change in design temperature on the heat load and heating energy demand more clearly, Figure 6 for the residential building and Figure 7 for the office building show the relative changes to the respective value at 20 °C. It is clear from the graphs that the change in design temperature has a smaller effect on peak load than on energy demand over the year. The heat load changes by only about 4 % for a one degree change in design temperature, whereas the energy demand changes by about 11 %. A comparison of the graphs for both building types shows that the results are similar for both buildings. At the low temperatures, the same changes are determined for the heat load and energy demand in both cases. At higher temperatures, the differences become larger, but are still in the same range. Building geometry, or the ratio of building surface to building volume, has little effect on the results for these example buildings.


Summary
The design temperatures specified in the standard for the load calculations already specify a reasonable level so that a comfortable ambient temperature prevails in the room for approx. 90 % of the users under the corresponding boundary conditions. It is assumed that users wear light short clothing in summer and long clothing with a sweater or jacket in winter. The influence of the design temperature on the peak load for the design of the heating surfaces is relatively small and thus plays a role at most when the output is just in the range between two model sizes. However, the much greater influence is seen in the operation of the system, as the energy demand is strongly dependent on the selected temperature in the room. In the design stage, you can only have a minor influence on the operation. As a user of a building, however, you can weigh the extent to which your chosen style of dress is appropriate for the season. Thus, in the end, only lowering the operating temperature could contribute to significant energy savings without sacrificing a comfortable room environment.
Dr. Peter Hollenbeck