-
Click on Visualization ….
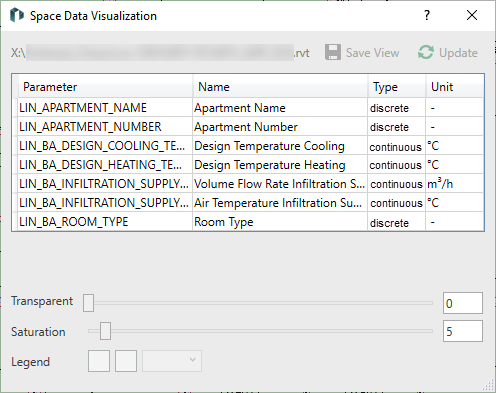
The Space Data Visualization dialog opens. If you opened the dialog from a 3D view, the visualization objects of the MEP spaces may already be displayed in this view.
-
Select the row of the parameter to be visualized.
-
Adjust Transparency and Saturation using sliders or by entering values.
-
Click on the two color fields for the Legend to adjust the colors between which the individual color gradations of the legend are generated.
The Color Selection dialog opens, where you can set the respective color using the slider.
-
Use the drop-down list for the Legend to adjust the number of color gradations.
-
Click on Update.
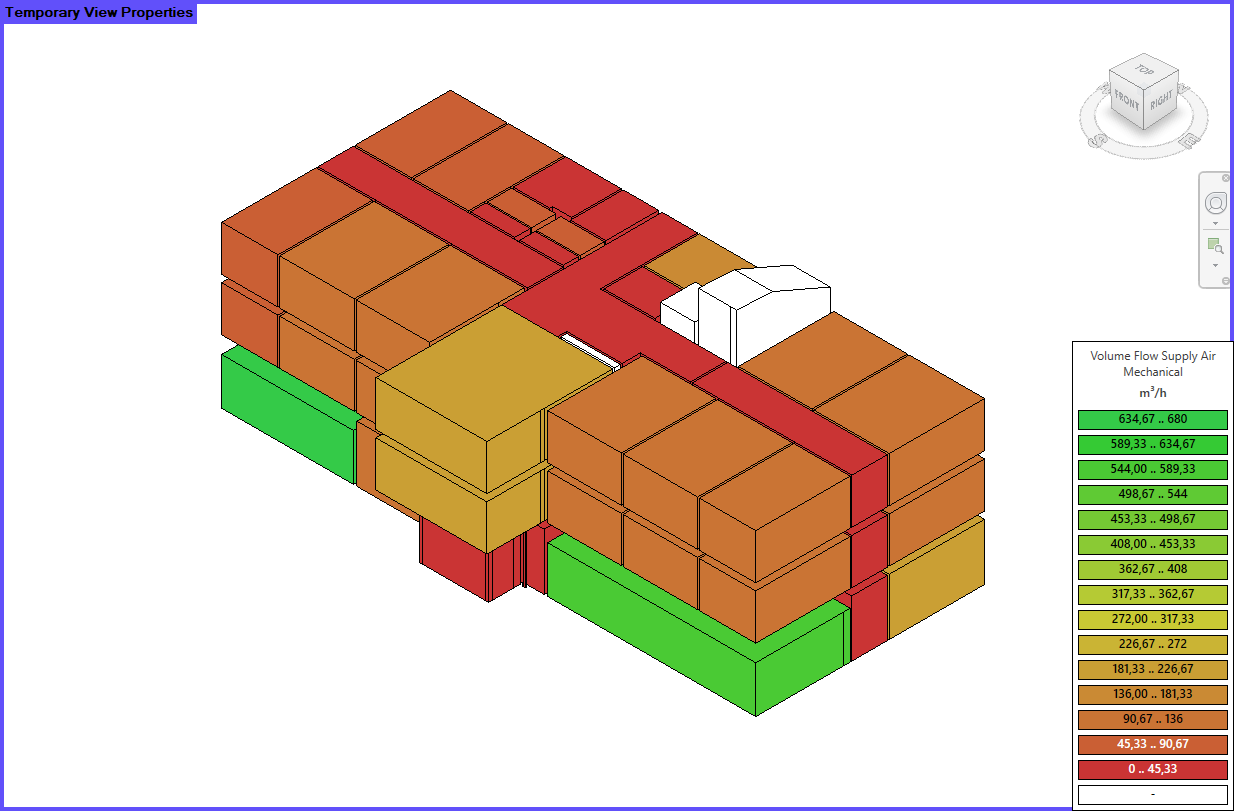
A temporary 3D view is generated with visualization objects for all MEP spaces in the project and a legend.
-
Click on Save View.
The Create New View Names dialog opens.
-
If necessary, change the name for the view and click OK.
The view is saved and is available under the 3D Views view type in the list of views at the bottom of the Project tab.
-
Close the dialog.
You have visualized the values of an MEP space parameter and saved the generated view.