-
Click Visualize.
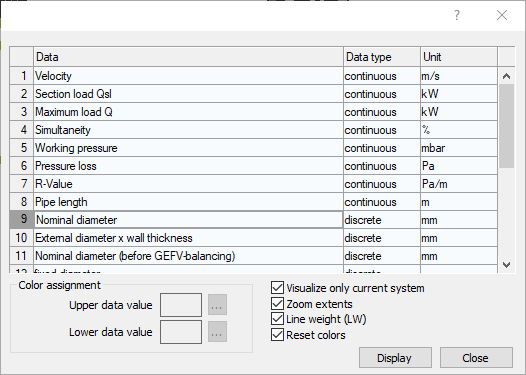
The Visualization dialog opens.
-
Under Data select the property to be displayed in color in the model.
-
If necessary, change the display settings Visualize only current system, Zoom extents, Line weight (LW) and Reset colors.
-
Click Display.
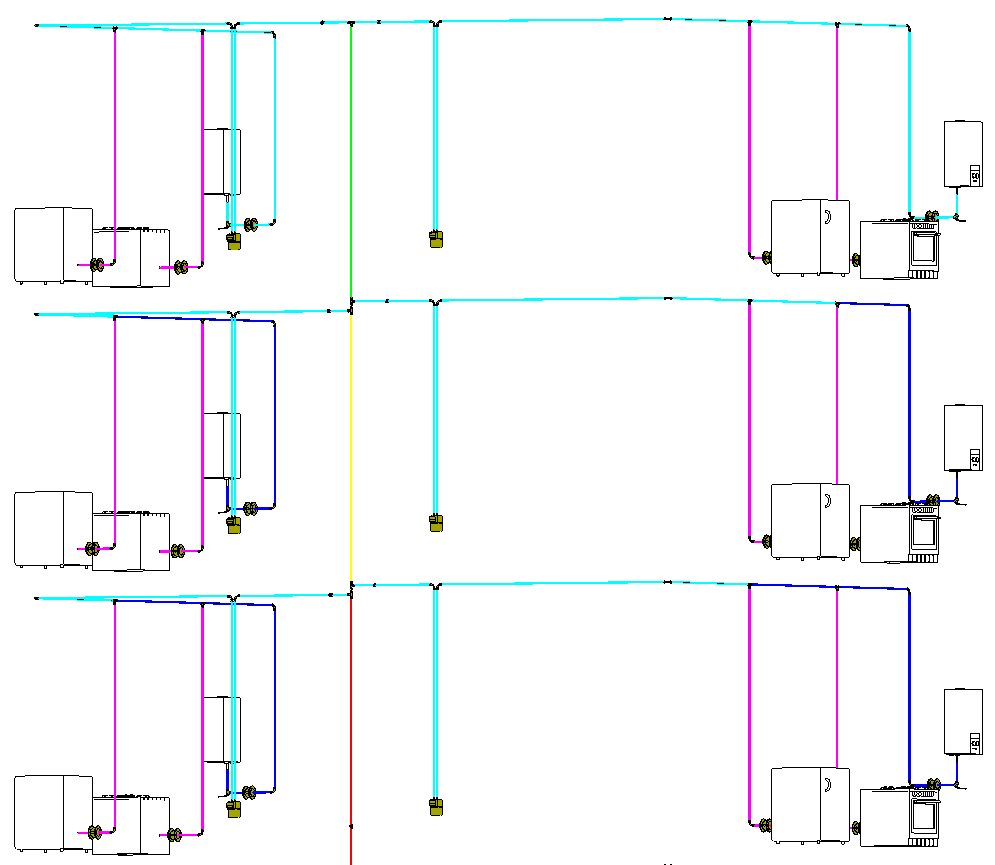
The selected property is displayed in color in the model. Pressing Enter brings you back to the dialog.